
GE Ultrasound Feature
Lung Diagram
WorkflowLung Diagram displays a schematic lung template directly on the ultrasound screen during point-of-care exams. Clinicians tap specific lung zones on the diagram to annotate findings such as A-lines, B-lines, consolidation, pleural effusion, or pneumothorax. Each zone records the pathology type and severity, building a structured visual summary of both lungs as the exam progresses. This replaces freehand documentation or memory-based reporting with a standardized, zone-by-zone record that follows established lung ultrasound protocols like the BLUE protocol. Emergency medicine, critical care, and pulmonology clinicians use Lung Diagram to document bedside lung assessments quickly and consistently, producing reports that communicate findings clearly to colleagues across shifts and departments.

Key Benefits
Why Lung Diagram matters
Zone-by-zone documentation during the scan
Clinicians annotate findings directly onto the lung schematic as they move through each scanning zone. This eliminates the need to write separate notes after the exam and produces a complete bilateral lung map by the time the transducer is set down.
Consistent handoff between care teams
The visual lung map communicates findings more clearly than text-based notes during shift changes or interdepartmental consults. A receiving physician can see at a glance which zones show B-lines, effusion, or consolidation without interpreting narrative descriptions.
Serial assessment tracking in critical care
ICU and emergency teams performing repeated lung ultrasounds on the same patient can compare diagrams over time. Tracking zone-level changes in B-line density or effusion volume across hours or days supports treatment decisions like fluid management and ventilator adjustments.
Supports structured lung ultrasound training
The zone-based format reinforces the systematic scanning approach taught in BLUE protocol and other lung ultrasound curricula. Trainees follow the diagram's zones in sequence, building consistent scanning habits and producing documentation that supervisors can review for completeness.
About Lung Diagram
Lung Diagram is a point-of-care documentation tool built into GE Venue-series ultrasound systems. The feature presents a bilateral lung schematic divided into anterior, lateral, and posterior zones consistent with standard lung ultrasound scanning protocols. During an exam, the clinician selects a zone on the diagram and assigns the corresponding finding: normal lung sliding with A-lines, pathological B-lines indicating interstitial syndrome, consolidation, or pleural effusion. The diagram updates in real time, creating a color-coded or annotated visual map of both lungs. This approach mirrors the structured methodology taught in the BLUE protocol and other point-of-care lung ultrasound curricula, where systematic zone-by-zone evaluation is required for accurate diagnosis. The completed diagram can be saved to the patient record and shared with referring physicians, providing a clear visual summary that is faster to interpret than a written narrative. For ICU teams monitoring ventilated patients or emergency physicians triaging acute dyspnea, the zone-based format supports serial assessments where tracking changes across lung regions over hours or days is clinically important. The structured output also supports quality improvement programs that audit lung ultrasound utilization and diagnostic accuracy.
Availability
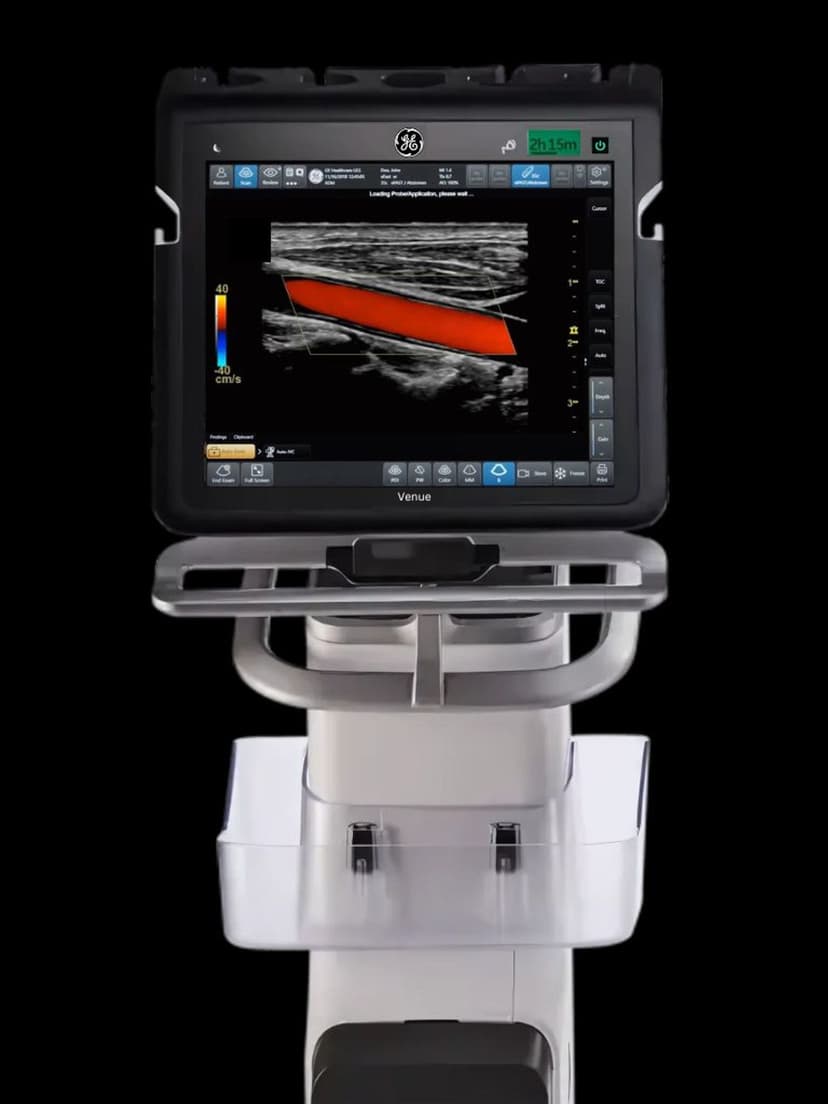
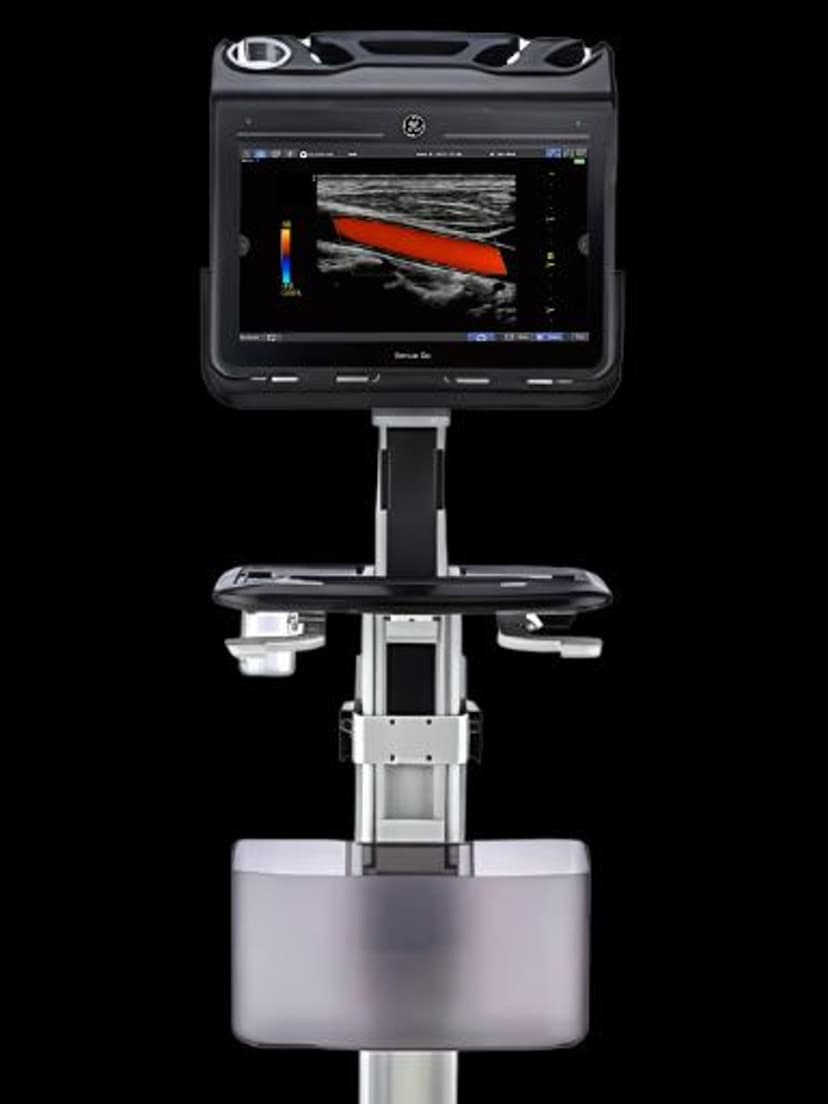
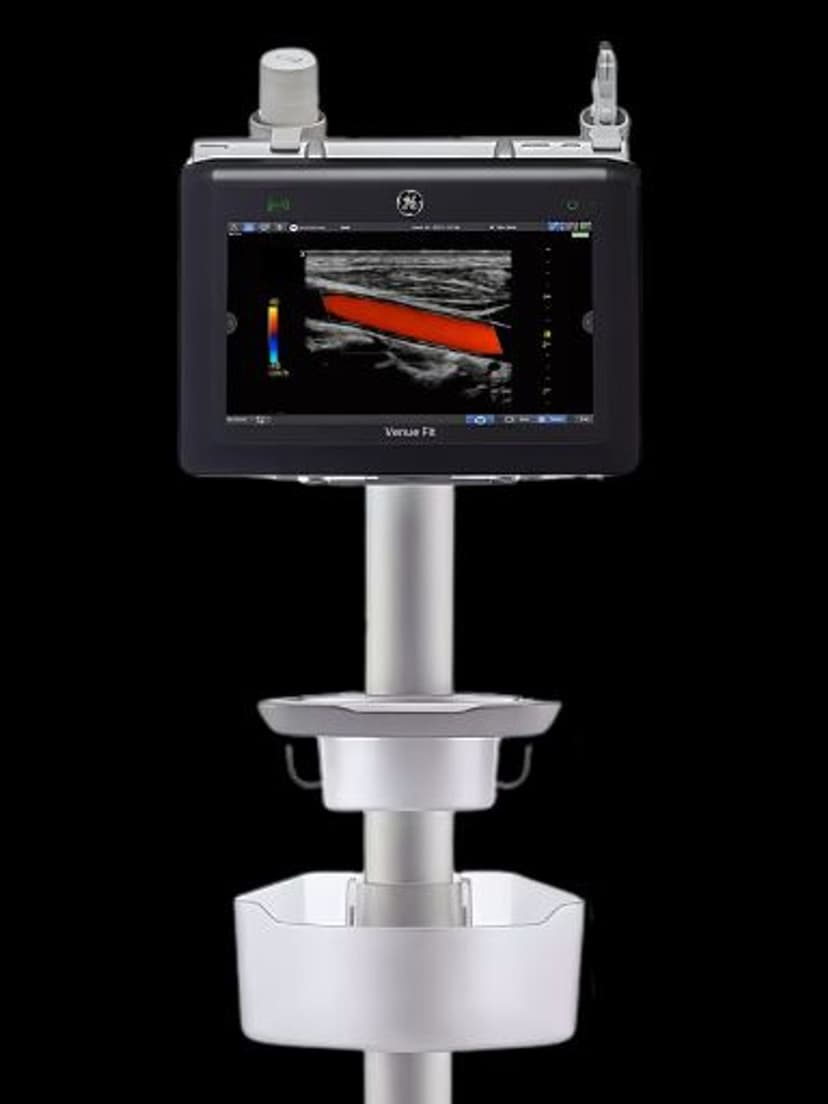
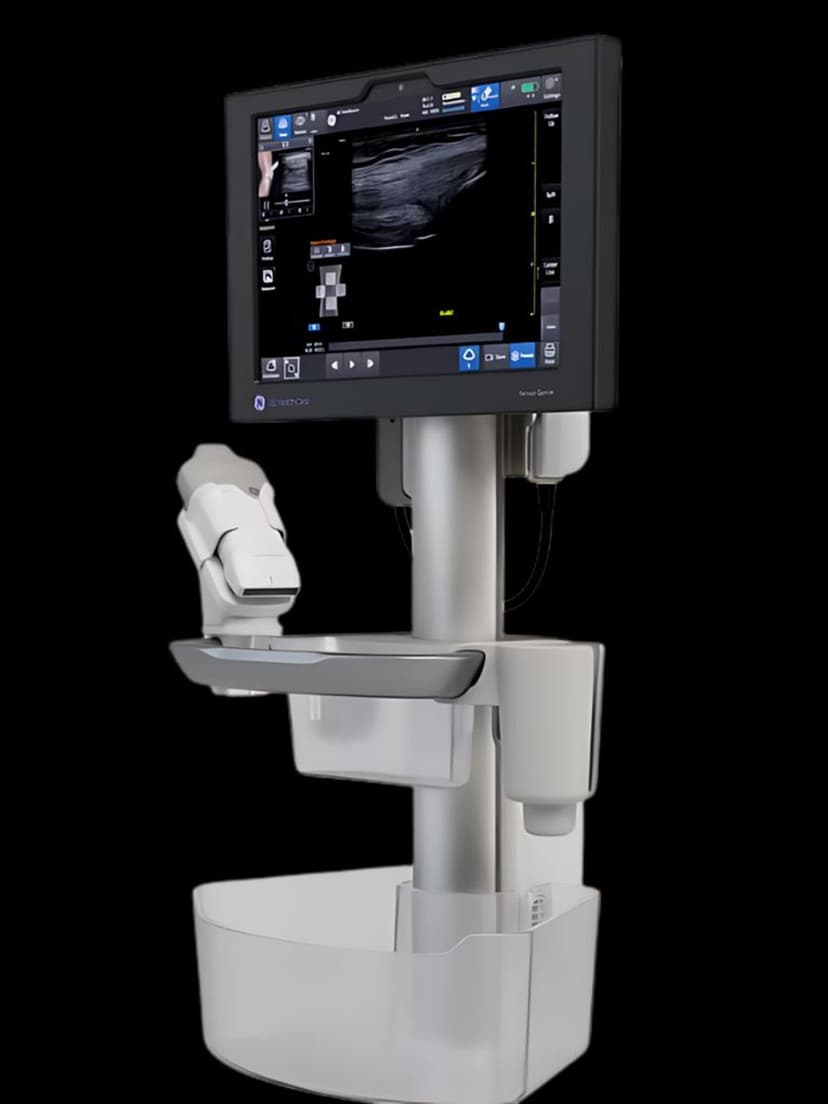
Available on these systems
Our Partners


Want Lung Diagram in your practice?
Request a quote for a system that includes this feature.